.png?width=161&height=74&name=considering%20AUSTIN%20(1).png "considering AUSTIN (1)")
Austin is the second fastest growing major metropolitan area in the United States. This March 2024 Austin Real Estate Market Update answers two important questions: 1) are Austin house prices going to crash; and 2) should I buy now or wait for interest rates and house prices to drop?
Austin Is Still Growing Fast
Central Texas continues to be one of the fastest-growing areas in the U.S. according to new Census Bureau data. The five-county Greater Austin Metropolitan Area is the 26th largest nationally.

The chart above includes San Marcos, which isn't typically considered part of Greater Austin, so the population totals may seem higher than you are accustomed to seeing.
For the first time in 20 years, among the five counties that make up Greater Austin, Travis County (where Austin is) was the only one of the five that had more people moving out than moving in. But it was a small amount; approximately 2,500 more people left than entered. In a county of 1.3 million people, that’s less than 0.2%.
Why Did Travis County's Population Shrink?
Affordability Issues
The cost of living in Austin, which makes up most of Travis County, has risen significantly. Between 2019 and 2023, the median house prices in Austin increased by nearly 53%, and rent prices also climbed, albeit at a slower rate
Housing Market Trends
People are finding neighboring counties such as Williamson County to the north and Hays and Caldwell Counties to the south more affordable. We recently featured an example of a new home in Lockhart, by a national builder, for $265,260 - perhaps a good option for a young family to become homeowners and start building wealth.
Job Market Changes
The job landscape in Austin has also been changing. Two of Greater Austin’s largest employers are completing construction on new locations, but they are in Williamson County: Apple has a new campus, which will grow to 15,000 employees. And Samsung is building a new $17 billion semiconductor manufacturing facility in Taylor, which is 30 miles northeast of downtown Austin.
Lack of Space for New Homes
A lack of space for new homes in Travis County is a significant challenge, leading to a need for redevelopment in the form of teardowns, rebuilds, or infill development.
In December 2023, Travis County, passed zoning reforms for Austin housing development allowing for more construction on single-family lots. The intention was to allow builders to construct up to three units on a lot previously zoned for just one house. The aim was to increase housing supply and address affordability concerns.
However, the Travis County zoning reforms face hurdles. Late last December, there was a court ruling in Acuña v. City of Austin, which found procedural issues, potentially halting parts of the reform. While intended to boost housing supply, the legal challenges and debate over public participation have created uncertainty about the reforms' future.
Williamson County’s Significant Growth
Williamson County stands out as a rapidly growing hub, welcoming 81,639 new residents between 2020 and 2023 - more than a 13% increase. You can see in the map below, Williamson County is North of Travis County and the City of Austin.

Williamson County includes many affordable suburbs with easy access to downtown Austin. Click the bulleted city names below for an interesting summary sheet. The PDFs are from 2019 but most of the information about schools, services, parks, etc., has not changed:
If Greater Austin is the second-fastest growing metro, who was number one? The answer is Jacksonville, Florida, though their growth rate was only 0.13% faster, so it’s essentially a tie.
Austin House Prices and New Home Construction
Will there be a house price crash in Austin?
Imagine you have a friend who said he had terrible luck at three-card poker in Vegas last Sunday. And as you’re starting to feel sorry for him, he mentions that he did great on Friday and Saturday and even with Sunday’s loss he still came home up 38%. That is Austin’s story.
In our February Market Update, we detailed about home price shifts in America’s 40 largest metro area housing markets. Austin is down 20.1% from its recent peak but it is still up 37.8% since March 2020.
Certainly, this recent run-up in Austin prices and the subsequent give-back of some of those gains is out of the ordinary for the Austin metro. Let's look at last time and now.
The Great Recession
Contrast the down 20%, but still up 38% recent moves to what happened during the Great Recession. The graphic below, from Reventure Consulting, shows the peak to trough price drop from 2007 to 2012 around downtown Austin at the zip code level.
Notice below how, at the end of the Great Recession, many areas around Austin had minimal house price deterioration. Contrast that with the calamity that was Vegas (down 60%), Florida (down 45%), and Arizona (down 50.8%). Sadly, Florida is once again experiencing some distress, but that has more to do with homeowner's insurance and HOA issues.

Looking at the graphic above highlights two truisms:
- Real estate is about location, location, location
- All real estate is local
Also, notice above, at the zip code level, large areas North and West of downtown Austin were unscathed during the Great Recession. The East Austin area, which struggled during the Great Recession, is currently undergoing significant gentrification as downtown Austin grows vertically. People want to live within a bike ride’s distance of all that downtown offers.
Current Market
Now, let’s look at a map of the same neighborhoods for the down leg of this cycle; i.e., from the highs of 2022 to now. Notice how much worse the drops are this time. By definition, the bigger the asset bubble, the more pronounced the drop appears on a dollar and percentage basis.

Please remember our Vegas metaphor, a bad day at the poker table does not mean a bad weekend overall. If you make a lot and lose a little, you're still ahead.
Let’s zoom out from downtown Austin and look at the Greater Austin Metropolitan Area with its 2.3 million residents. In the table below, you see similar house price drops at the county level, both on a year-over-year basis and since the 2022 high.
For those interested in Austin real estate statistics for investment properties, I included Cap Rates by county and Rent as a Percent of Median County Income.

How do you feel when you see these charts and price drops? Yikes, right? But those charts lack context. Does your opinion change when you look at the chart below, which not only shows the recent drops, but also the preceding gains?
The chart clearly shows a long-term trend line and then the pandemic spike up and then reversion to the mean, i.e., back toward the trend line. If you put a ruler from the 2012 January value to January 2020, and then extrapolate that to now, you see our current value is just about on that trend line. Does that mean prices are stable? It depends... on what happens with rates, the economy, politics - you get the picture - no one knows for sure.

If you bought a home in 2020 for $309,000 and now it’s worth $425,000, would you be upset? The point I’m trying to make is be careful when people show recent data and say the sky is falling, or vice versa. All data should be looked at in the context of this question: compared to what?
Ryan Robinson, City of Austin Demographer projects the Austin metro population by 2030 will be 3,063,825. Over the long term, housing tends to do well in growing cities with abundant land and high-paying jobs.
Bottom Line
Austin-area house prices have come down significantly from their all-time high, but they are still up considerably from just three years ago.
House Price Crashes – Then and Now
In the Great Recession, house prices crashed for two reasons:
- Loans were available to people who could not pay them back
- The supply of houses exceeded demand.
That is not the case today for three reasons:
- Inventory is tight (not enough houses) because too few houses were built in the years after the Great Recession and because of rate-lock, i.e., all the people who don’t want to sell because they have an interest rate below 3%
- Lending standards are tight, much more than before
- Americans have significant home equity
House prices crash when there are more sellers than buyers, especially distressed sellers. That is not the case today.
Insufficient Housing Construction
First, look at this chart of United States Housing Construction Since 2000. Notice the pink line (Single-family Units) is considerably below its 2006 peak, and how for a decade (2008 – 2018), it was way below its pre-recession norm.
In simple terms: they didn't build enough houses for a decade after the 2008 crash. This is understandable because banks and builders were recovering from their almost existential losses.

Tight Lending Standards
Next, home loans are not easy to get. Anyone who has gotten a loan recently knows this is true, even when they have a good income and a high credit score. For those who don't, it's nearly impossible.
The subprime industry is all but gone, which is not necessarily optimal. Say what? Even at the worst of the housing crisis, two-thirds of all subprime loans were paid on time. Now, that audience has no choice but to rent. This is unfortunate because owning a home is one of the best ways for average people to build wealth.
For a fascinating discussion on what happened in 2008 and why this time is not the same, check out a recent podcast with Barry Ritholtz and Sean Dobson, CEO of Amherst Holdings, LLC. They manage $16.8 billion with a focus on single-family homes. I have never heard a better recap of the mortgage and housing meltdown - and I was at the epicenter of it.
Record Home Equity
Third, Americans have a record amount of home equity. As you can see in the chart below, over 70% of homeowners owe less than half the value of their home.

Did you know, during the worst of the 2008 housing crisis, approximately 23% of all homes were worth less than the mortgage loan.
According to Core Logic, “The average U.S. homeowner now has more than $274,000 in equity – up significantly from $182,000 before the pandemic.”
As you would expect, with that much equity there are few foreclosures. The following chart shows exactly that, foreclosures are at historic lows, even lower than before the pandemic.

During the worst of the Great Financial Crisis, 10% of mortgages were delinquent, compared to 3.34% today. And 4.63% were in foreclosure, versus 0.4% today – that is more than a 10x drop. That's a good thing!
Bottom line: the percentage of delinquent loans is small because most homeowners have a low interest rate, which means a manageable house payment, they were well-qualified for the loan they have, and there aren’t enough homes available to buy.
When housing demand exceeds supply, as it does currently and will for some time, do not expect house prices to crash.
Mortgage Update
Mortgage rates are at their 52-week average of 6.9% as you can see in the graphic below.

Is this the new normal? The fifty-year average of 30-year fixed rate conforming mortgages according to FHLMC, Freddie Mac, is 7.64%.
Notice from the chart above that that is in the range of where rates have been in the last twelve months. So, you could say, on average, rates are neither high, nor low. They’re average.
And notice the chart below shows the average annual mortgage rate has been as low as 3.87% in 2022 and as high as 18.63% in 1981.

Young people who feel like their parents had it so much easier when it comes to mortgage interest rates haven’t seen this chart. To be fair, they have a point because houses used to be a lot cheaper. In a normal market, these higher rates would have pushed prices down, but we are not in a normal market as outlined above.
Should I Wait to Buy?
We often hear people say, “I’m going to wait until interest rates go down to buy a house – affordability is awful right now." They are right about affordability, which we explained in our February Market Update.
It is likely that when rates come down, ‘wanna-be’ home buyers will jump into the market, and that will put upward pressure on house prices... again.
An important question for those thinking of buying is, “Should I buy now or wait until mortgage rates go down?” We can analyze that and quantify our answer. Let’s look at an example.
Imagine the following scenario:
- Purchase price: $650,000
- Down payment: 20%
- House appreciation rate: 3.5%
- Interest rate now: 6.875%
- Interest rate in 2 years: 5.875%
Before we run the numbers, let’s agree that no one knows where interest rates will be in two years and we're guessing on house price appreciation. Below is a chart with different experts' opinions on house price appreciation over the next twelve months.

For our hypothetical example, let us use the middle estimate of appreciation, i.e., 3.5%. Here is an example of the report we can generate.

Notice, waiting resulted in a payment that is 8.5% higher ($5,428 vs. $5,001), even though the 'wait two years to buy' strategy had a projected lower interest rate (5.875% vs. 6.875%). The estimated future value in two years is $696,296, which equates to total appreciation of $46,296. The only appreciation that accrues when renting is to the benefit of the landlord.
Real estate is key to building wealth for 'normal' families because of its unique characteristics including leverage, utility, inflation hedge, and tax advantages. That said, remember, all real estate is local. Will homes appreciate 3.5% over the next two years? No one knows. If you would you like a report for a purchase you are contemplating, please reach out.
Bottom line: if values go up modestly and rates drop a bit, waiting will not have been a good decision. If house prices are lower in the future, then it will be a different story.
Austin Housing Market Updates
Stewart Title publishes great flipbook housing market updates. Click the following links for Austin and surrounding areas:
- Existing homes: Housing Market Update April 2024 - Residential Resale
- New homes: Housing Market Update - April 2024 - New Construction
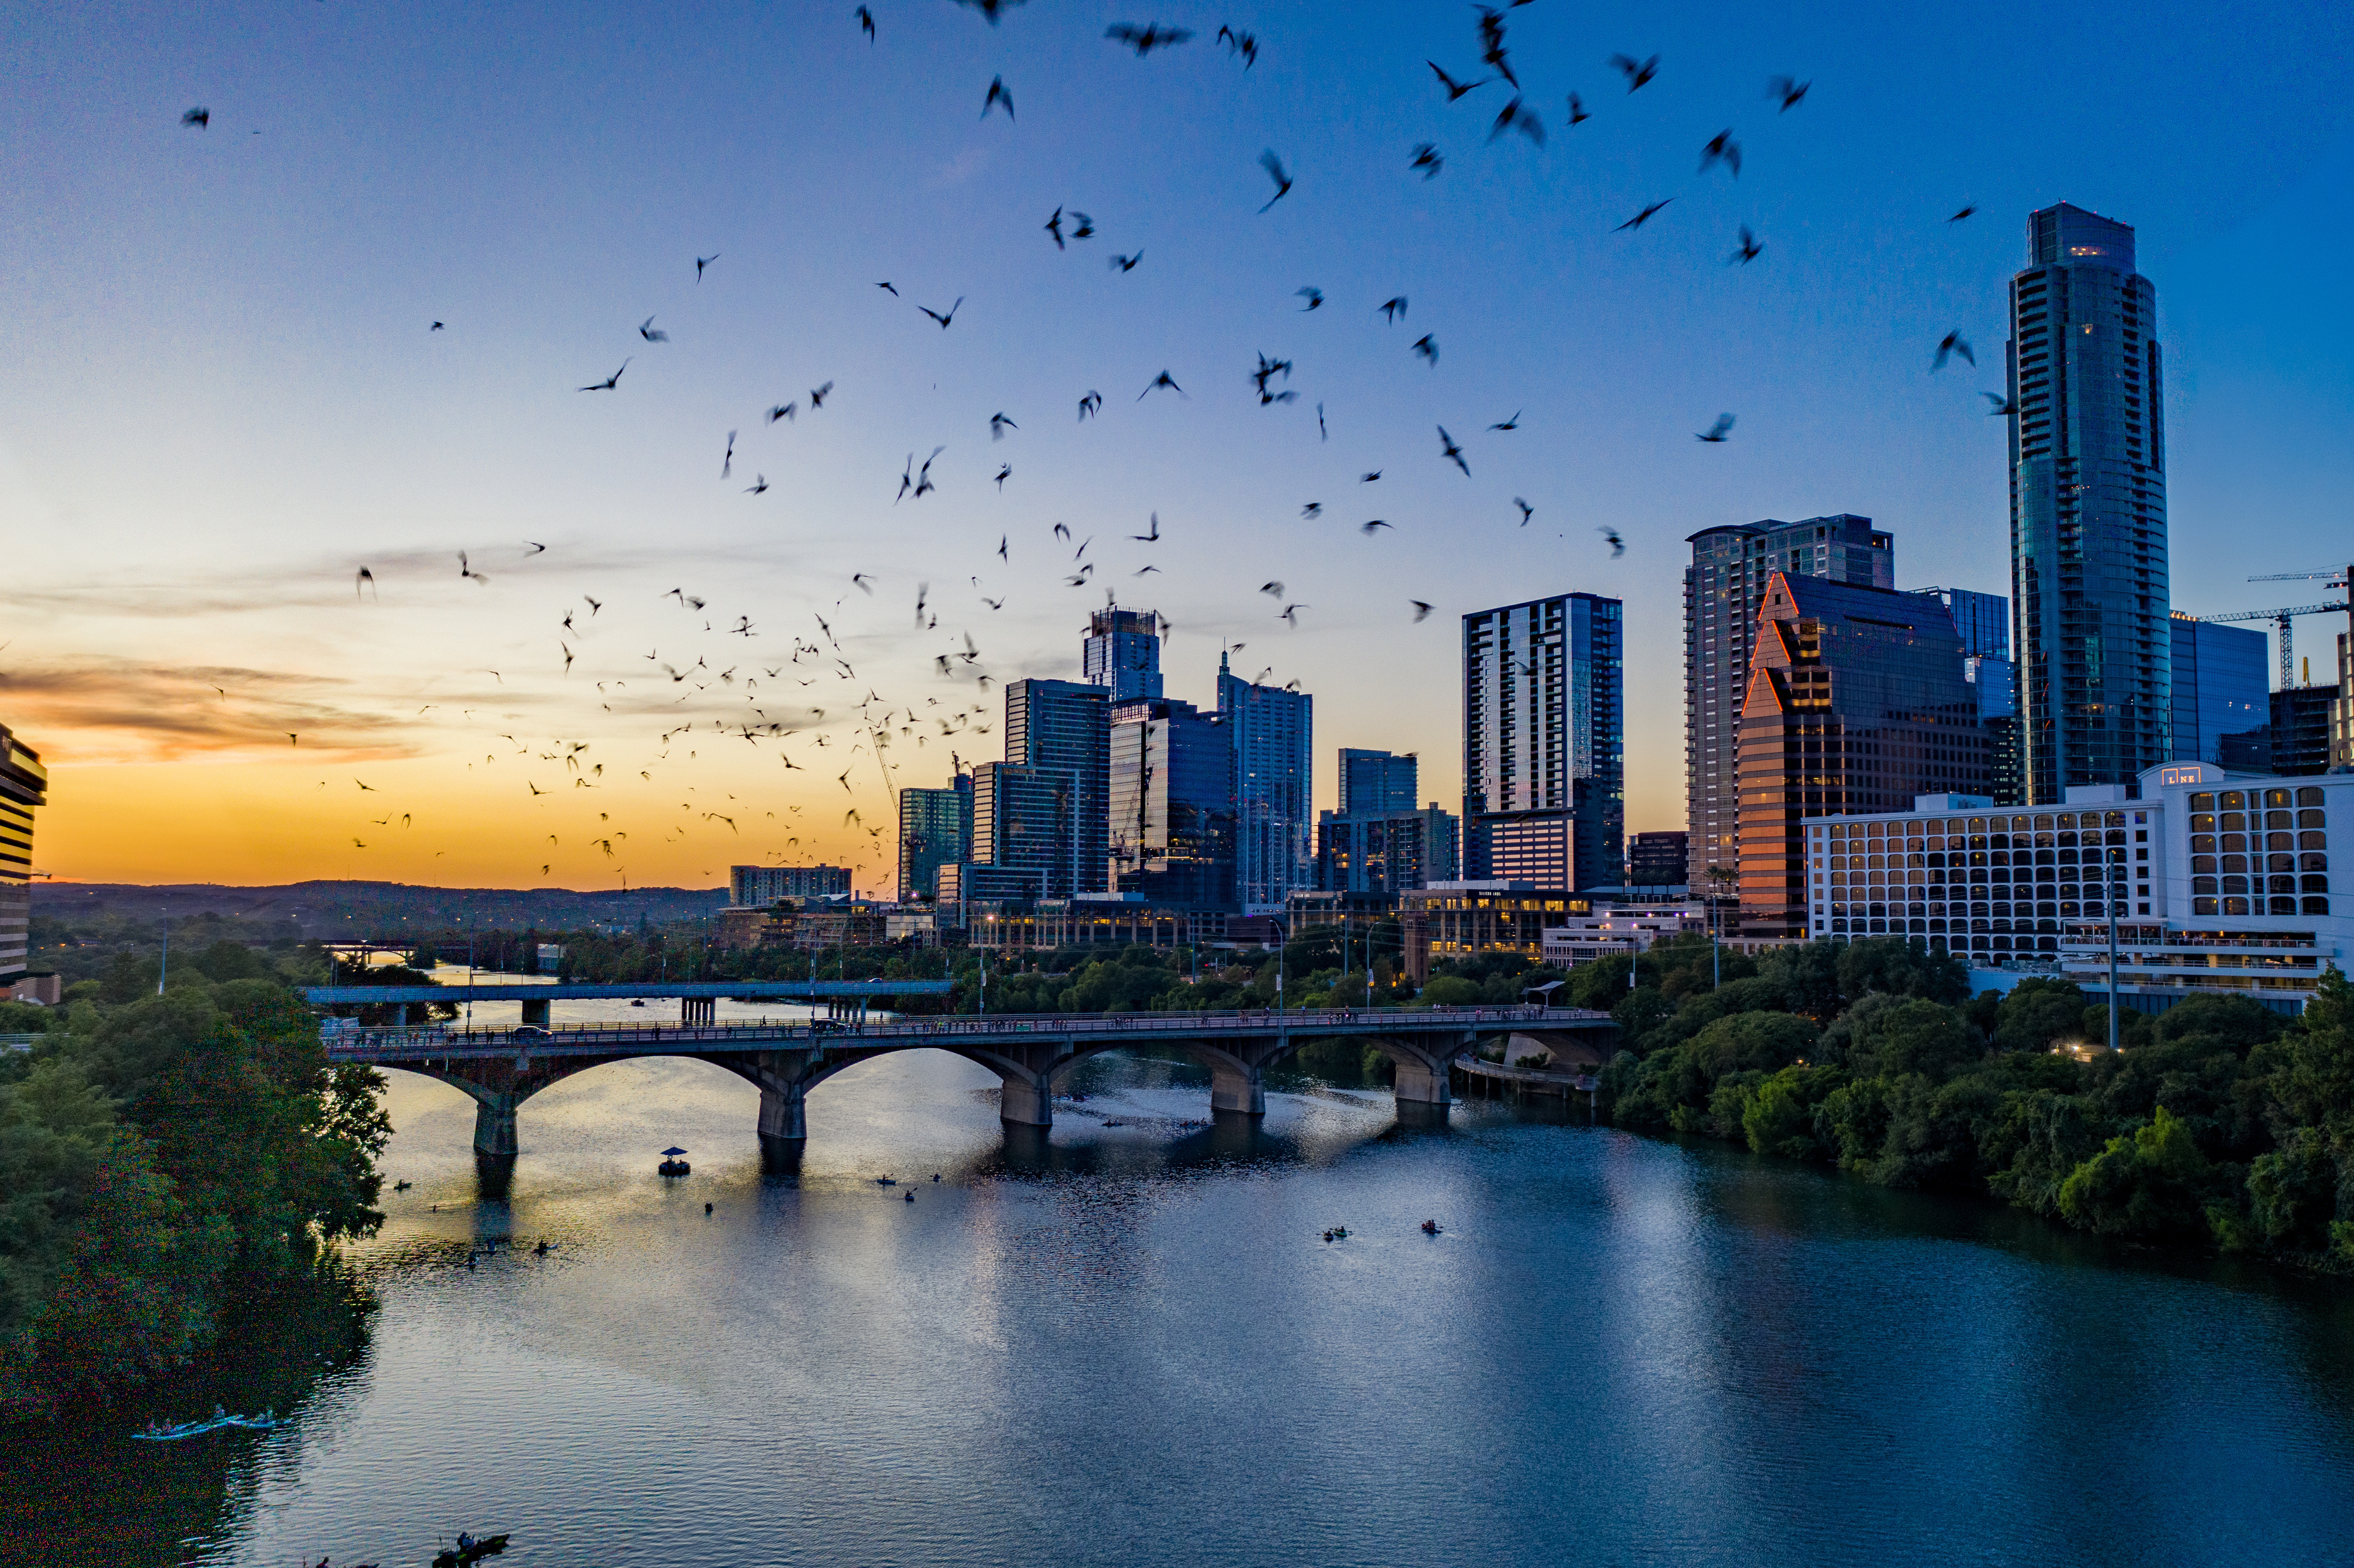
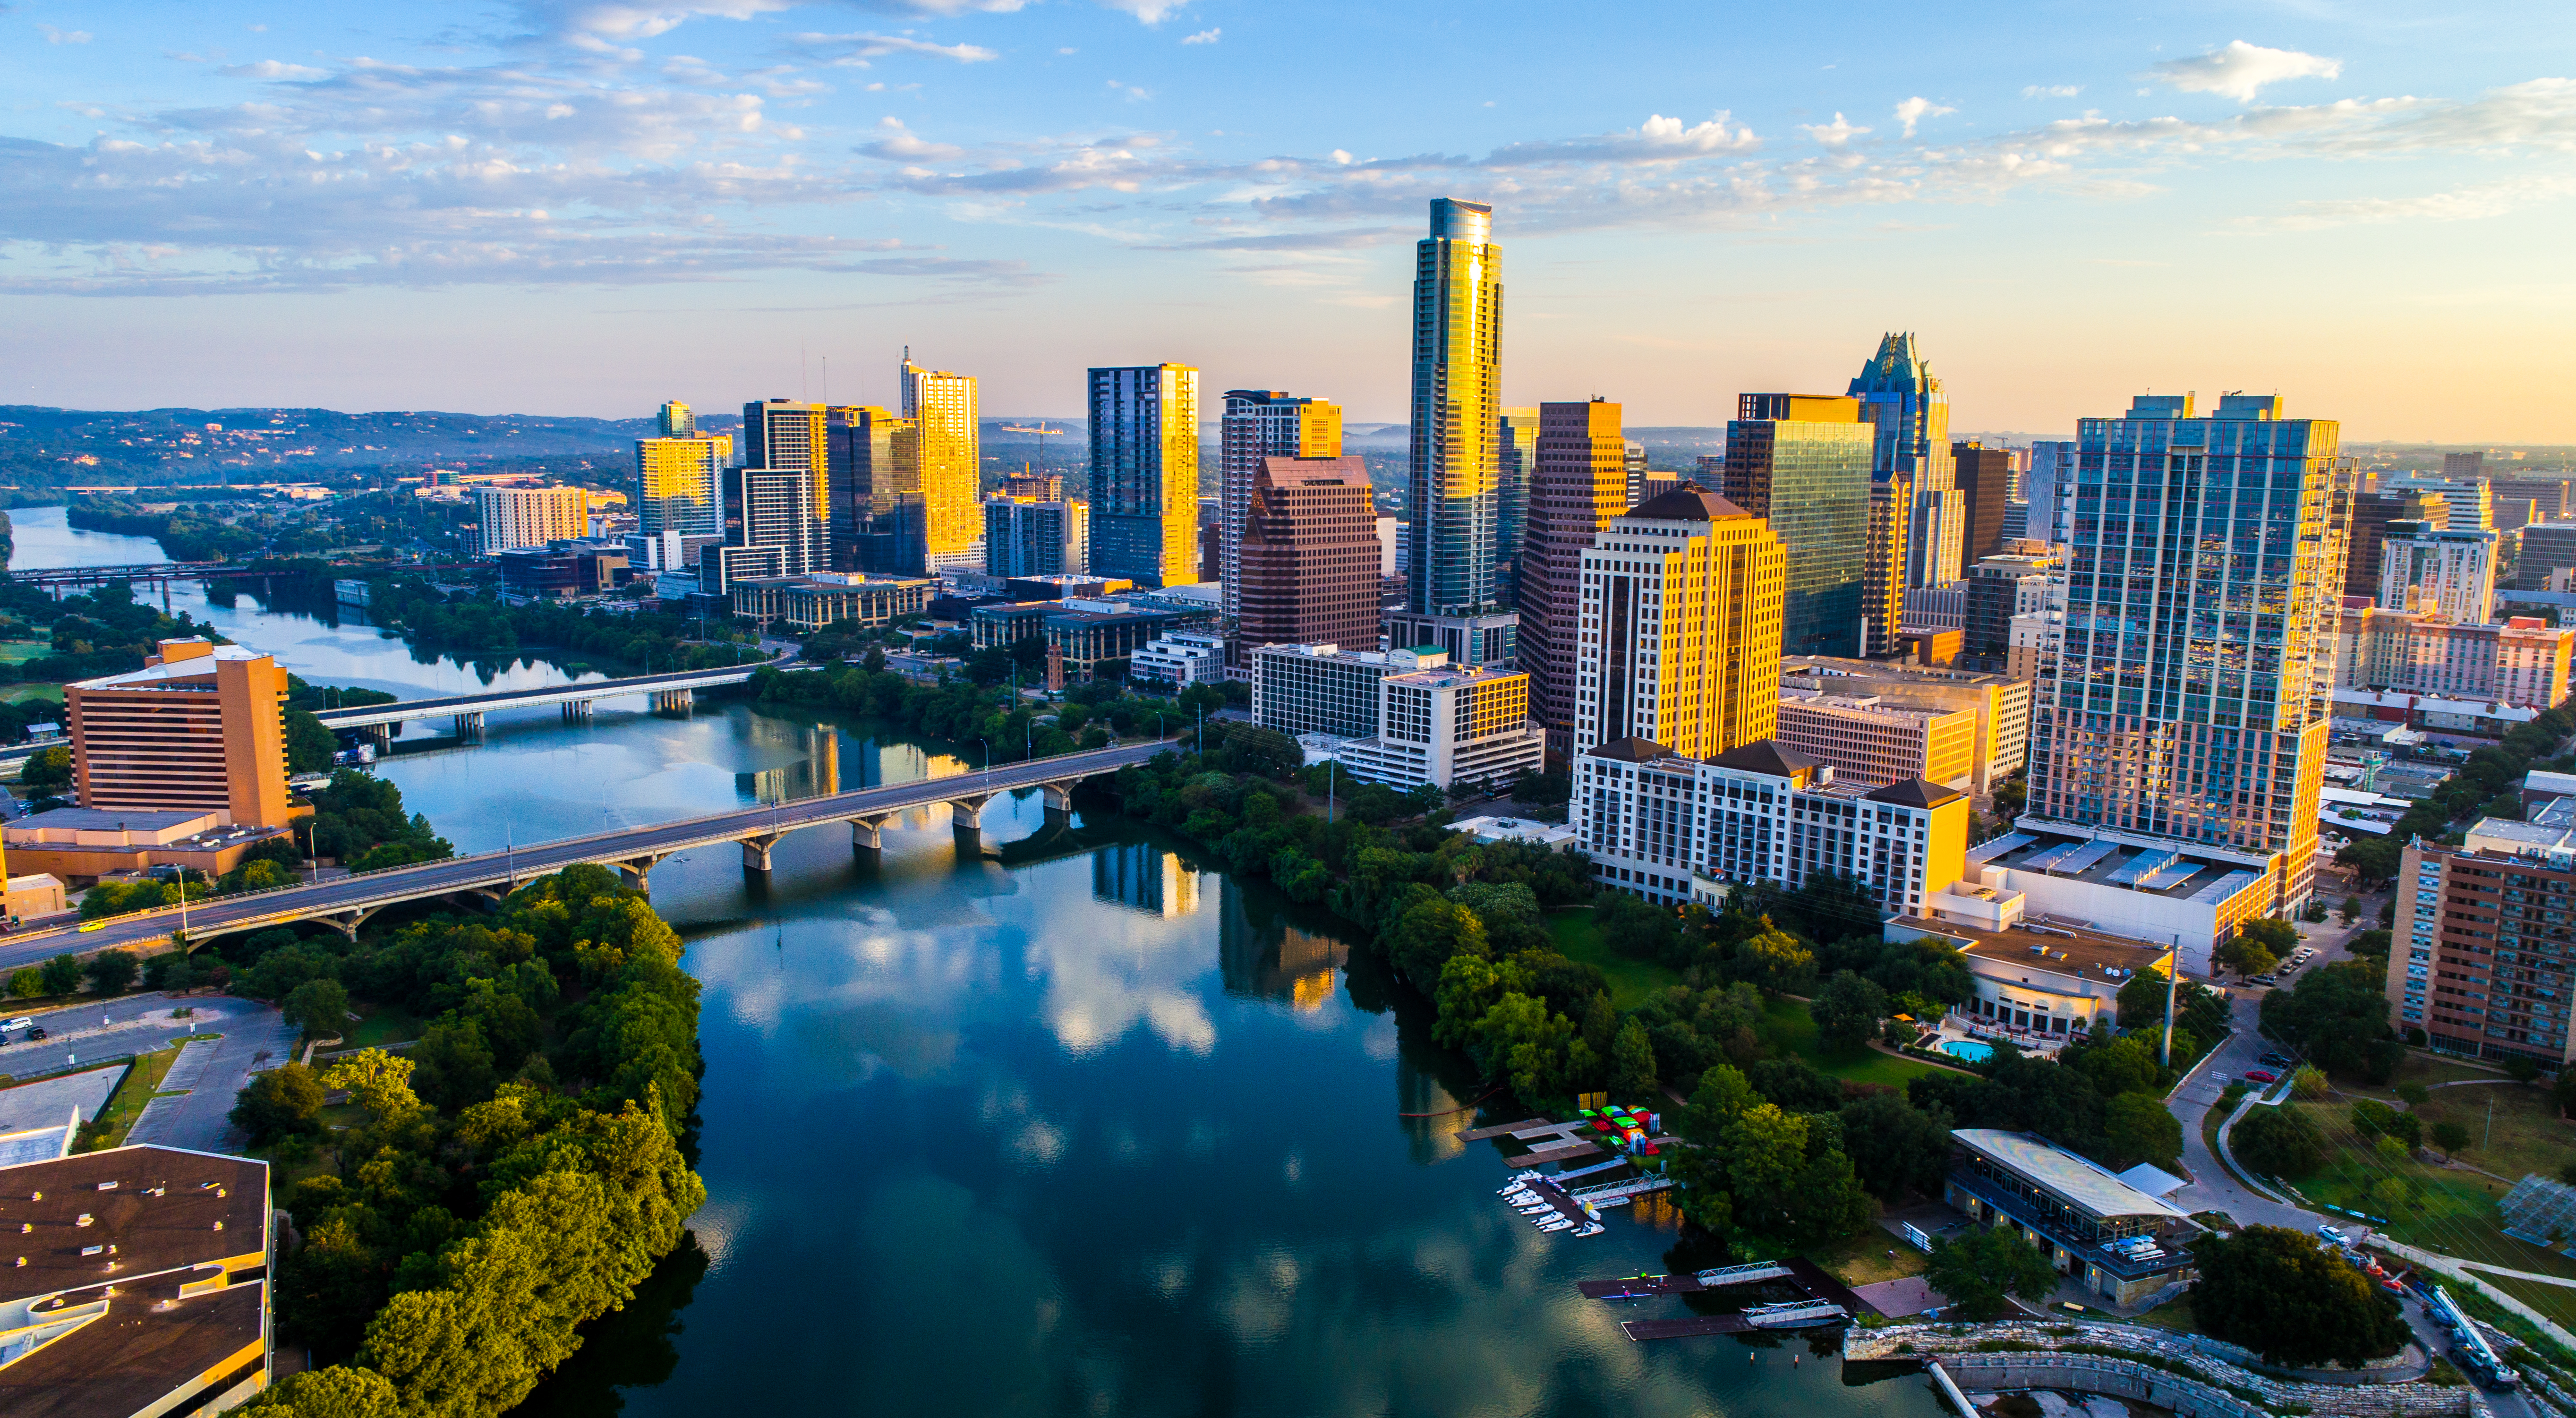
Downtown Austin Update
Did you know Austin will soon have a 74-story skyscraper? It will be called Waterline and it will be the tallest building in the State of Texas. It will also be the tallest building between Chicago and the West Coast. Check out these beautiful pictures courtesy of ATCHAIN and KPF.


The new building’s website is: https://waterlineaustin.com/. Visit their website for more great artist renderings.
Here is a list of the tallest buildings in other major cities:
- New York City, Central Park Tower – 98 floors, 1,550 ft
- Chicago, Willis Tower – 108 floors, 1,451 ft
- San Francisco, Salesforce Tower – 61 floors, 1,070 ft
- Los Angeles, Wilshire Grand Center – 73 floor, 1,000 ft
- Seattle, Columbia Center – 67 floors, 974 ft
Below is a table of Austin’s tallest buildings. Notice the completion dates in the far-right column.

Our Impression of Downtown Austin
We flew to Austin in 2017 to buy a house. And our home was completed in 2018. Notice only two of the eleven skyscrapers listed above were built when we relocated. I remember when we drove by downtown, I said, “Is that it?”
Personally, I think Austin has one of the most beautiful downtowns I’ve seen, and I’ve been to all the major cities listed above. One of the great things about it is how its becoming cosmopolitan, yet its still relatively small and safe.
Back in 2017, I didn’t even know a river ran through downtown Austin. The first summer we were here we rented stand-up paddle boards and went out on the river that runs through downtown. The water was cool in the summer and very clean. It was and is a lot of fun.
If you want to see a video of people having fun, click this video. My daughter did the same thing as that girl who jumped off the bridge at the 3:08 mark. Of course, I wasn’t happy, but her reply was, “Dad, YOLO.” Ah, the confidence of youth.
For a more serene view of paddling in the river, check out this video.
Our Service Offering
At Considering Austin, we are highly competent at relocation services encompassing four roles:
- Relocation consultant
- Buyer’s agent
- Mortgage advisor
- Financial educator and coach
If your family is thinking of moving to the Austin area, and you don't want to make one of the 10 Biggest Mistakes When Relocating that waste time and money, we are happy to discuss your unique situation and offer guidance at no charge. We can be reached at (512) 981-8279. If we can’t help you, chances are high we can refer you to just the right professional who can.
Also, be sure to check out our February Market Update where we spotlighted Austin's prestigious national rankings and discussed the Austin Arbitrage™.
Yours to count on,
--Kent
Resources:
- https://communityimpact.com/austin/south-central-austin/real-estate/2024/03/15/austin-area-continues-to-see-population-increase-falls-out-of-fastest-growing-metro-ranking/
- https://www.census.gov/data/tables/time-series/demo/popest/2020s-total-metro-and-micro-statistical-areas.html
- https://www.kut.org/austin/2024-03-19/austin-population-census-data-net-migration
- https://www.consideringaustin.com/austin-favorites/new-affordable-homes-near-austin-tx
- https://casetext.com/case/city-of-austin-v-acuna
- https://reventureconsulting.com/
- https://www.ktnv.com/news/history-a-look-at-the-housing-bubble-burst-and-long-term-impact-on-las-vegas
- https://www.newsweek.com/florida-housing-market-trouble-1874962
- https://www.citypopulation.de/en/usa/metro/12420__austin_round_rock_geo/
- https://twitter.com/atxREpodcast/status/1737857274679632111
- https://www.freddiemac.com/pmms
- https://dqydj.com/historical-home-prices/
- https://www.apartmentlist.com/research/how-many-new-homes-are-under-construction-today
- https://www.corelogic.com/intelligence/homeowner-equity-insights-q1-2023/
- https://www.npr.org/sections/thetwo-way/2009/11/one_in_four_us_homes_underwate.html
- https://www.icemortgagetechnology.com/resources/data-reports/first-look-at-february-2024-mortgage-data
- https://www.stlouisfed.org/on-the-economy/2021/may/mortgage-distress-great-recession